
Don't ignore this!

.jpeg)
This week, I want to pull back the curtain on one of our most important processes at Playstack, how we analyze YouTube video performance to improve and grow channels continually.
It's one thing to make videos, and that is an achievement in itself, but the next thing is to get results. The problem is, a lot of people give up on an idea, style or format because they get bad results after 1 or 2 videos.
Opposite, people fail to double down on any success they have, something like above-average hook retention or any parts of the video that get more attention because of editing or storytelling.
I'll share with you the parts of a video are worth looking at that determine success even tho you might not get a lot of views. As you know we work with a lot of businesses and views are not always the main indicator of success, but conversions or engagement are. This is where retention is very important, to build trust and authority.
Retention is also one of the main indicators of success for any video, resulting in more views. We noticed that videos above 40% retention usually get boosted more in views.
Worth Watching
Part of what I do daily is consume a lot of content, and here are some of my favorites:
We created a full YouTube Idea Bank with all the previous outliers.
Format: Outlier score (multiple of average last 5 videos) \ Channel Name - Video name + link - My notes
- 1.9 | Law By Mike- I Spent 24 Hours With Real Criminals
Very short and clear intro, straight into what people are interested in. The topic itself is contrarian and interesting: a lawyer spending time with criminals.
It's an entertaining way to provide value and bring attention to a business. - 70.0 | Exposure Ninja - The Best SEO Strategies for 2025
A topic covered by many, in this video they cover the actual truth, no bs. They also make it very clear and understandable through screen sharing and graphics. - 16.2 | Jasper Aiken - How I Sell "Smart Websites" To Local Businesses
A typical business driving video and very well executed. Super transparent that the person is an affiliate for the tools he uses but he very open with the information provided. He targets other website builders and not so much ideal clients. Video shows what a bad example is and what a good example is and uses a lot of emotional triggers.
Data-Driven YouTube Success
Creating great content is just the beginning. The real magic happens when you systematically analyze what's working and why.
One thing I've been very obsessed with is capturing data, because now with AI it's a lot easier to create systems, conclusions and tools out of data.
Here's a look into our performance analysis workflow:
1. Deep Retention Analysis
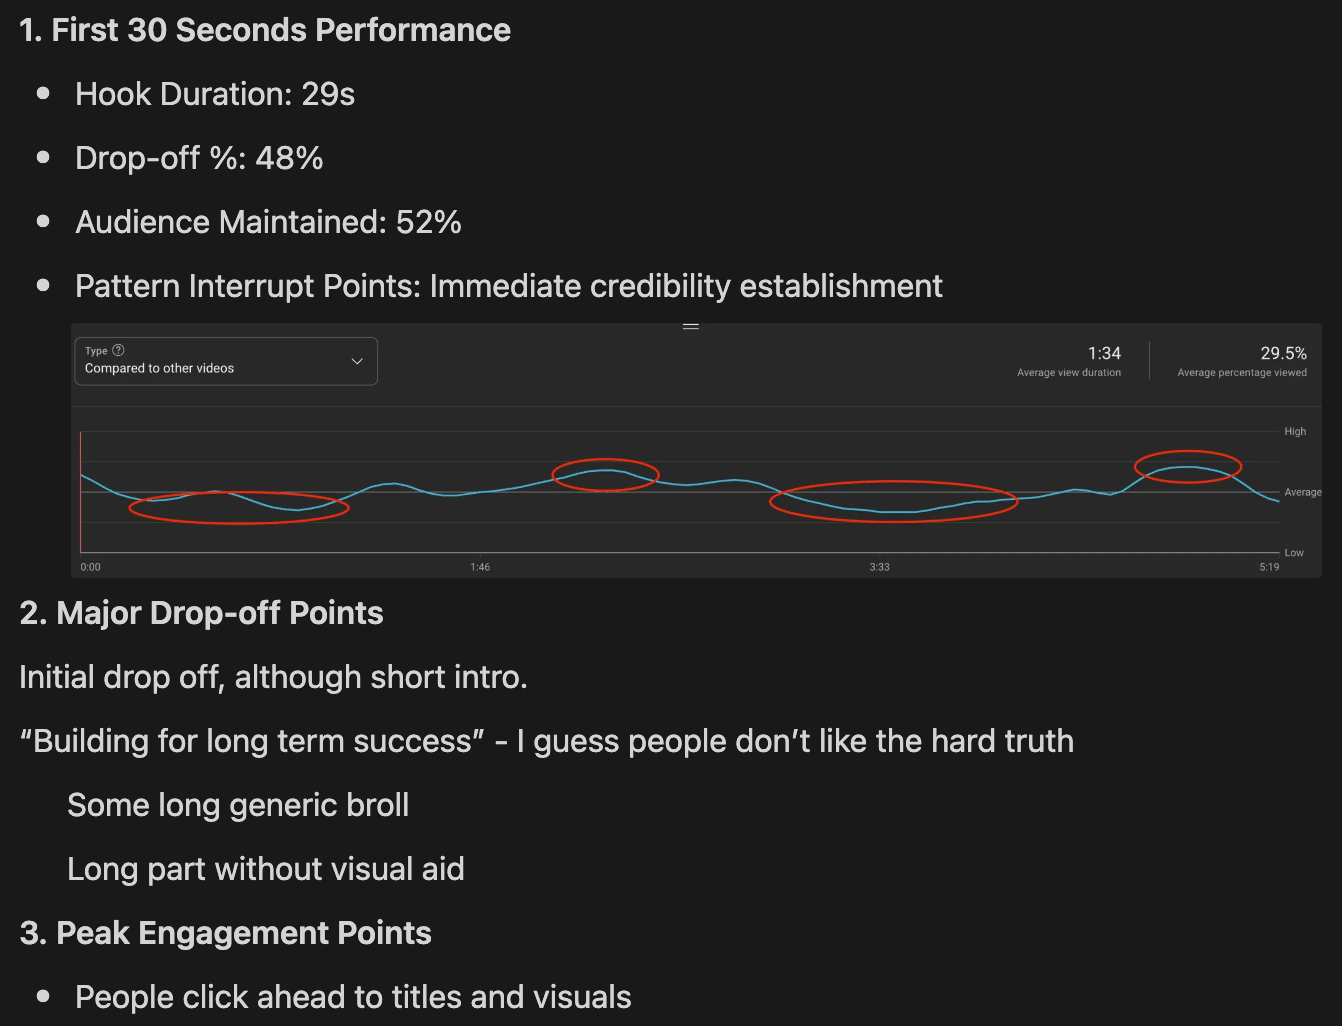
We don't just glance at view counts. We dig into the retention graphs to understand exactly where viewers are engaging and dropping off.
The YouTube retention dashboard now offers incredible insights, including:
- Comparing subscriber vs. non-subscriber retention
- Separating organic vs. paid performance
- Identifying pattern interrupts that actually work
Pro Tip: Look for those flat or upward spikes in your retention curve - these are golden moments where your content is truly resonating.
2. Hook Analysis Framework
Your first 30 seconds make or break your video's success. We analyze hooks by:
- Identifying the specific pattern interrupt type used
- Transcribing the exact opening lines to spot patterns
- Categorizing hooks (statistics, contrarian statements, emotional triggers)
- Correlating hook types with actual performance
One pattern we've noticed: Statistics combined with contrarian statements often perform exceptionally well with new viewers, while emotional hooks tend to work better with existing audiences.
3. Content Structure Breakdown
We map your entire video structure with timestamps to identify:
- Key segments that drive highest engagement
- Natural drop-off points that need improvement
- Psychological triggers used throughout (curiosity, authority, etc.)
- Transition effectiveness between segments
Some examples are that generic stock footage tends to lose the attention of people but text graphics attracts them when done well.
Too much text makes people click off. A trick for this is having the text roll in word for word as someone is reading a book to keep attention so they are not overwhelmed with too much text at once.
4. Audience Segmentation Insights
Different content attracts different audiences. We analyze:
- New vs. returning viewer percentages
- Traffic source variations
- Demographics performance
- Audience alignment with business goals
This helps determine if your video is serving your core audience or expanding to new viewers - both are valuable depending on your goals.
Automating Your Analysis
The biggest challenge? This process is time-consuming. We're actively working on ways to automate these insights using YouTube's API and AI tools.
In the meantime, we've created comprehensive templates that help streamline the analysis. Our AI prompt framework can take a video transcript and automatically identify:
- Hook types and effectiveness
- Pattern interrupts used throughout
- Psychological triggers employed
- Content structure breakdown
- Improvement recommendations
Reply to this email and I'll share our Video deep-dive template for your AI.
Putting Insights Into Action
The real value comes from implementing what you learn. For example:
- When we notice certain hook types consistently outperform others, we prioritize those in future videos
- If specific segments see retention spikes, we develop dedicated videos around those topics
- When we identify drop-off patterns, we restructure future content to maintain engagement
- Adding timestamps and chapters in the description that create curiosity or clarity rather than, step 1, step 2 or tip 1, tip 2 ...
Your Turn
Start small - pick your best-performing video and your worst-performing video. Compare:
- The hook approach (first 30 seconds)
- The content structure
- The traffic sources
- The audience demographics
The patterns you discover will likely reveal immediate opportunities to improve your content strategy.
Want help implementing a data-driven approach to your YouTube growth? That's exactly what we specialize in at Playstack.
What are some of your data insights you gathered?
Scripted videos vs Freestyle, which one is better, for you?
Want to work with me to grow your business?
If you’re a 7-8-figure founder or agency that wants to grow your YouTube channel, membership, and course — I’d love to work with you.
For 6-figure+ founders and channels, join an exclusive group with 5,500,000+ total subscribers.
Get access to founders, agencies, course creators, community builder and more...
Subscribe for weekly insights on how to build a community of true followers and turn viewers into customers with evergreen video sales assets.
.jpeg)
.jpeg)
.jpeg)